The case for index funds
Passive vs. Active Investing
When it comes to investing, there are two primary strategies to consider: passive and active investing.
Passive investing involves tracking a market index, such as the S&P 500. This method relies on the overall performance of the market, with the understanding that, over time, the market will typically increase in value. While it’s true that both passive and active investing strategies involve some degree of human judgment (for instance, in the selection of which index to track), passive funds typically involve less trading and therefore carry lower fees. This is one of the primary advantages of passive investing: the lower costs can lead to higher net returns over time.
Active investing, on the other hand, involves a more hands-on approach. Active fund managers aim to outperform the market by selecting and managing a portfolio of individual stocks, bonds, or other assets. However, data has shown that active managers often struggle to consistently beat the market over long periods of time. This is partly because the costs associated with frequent trading can eat into returns, and also because accurately predicting market movements is notoriously challenging.
Consider this: if professionals who dedicate their careers to active investing have a hard time beating the market, it might not be the best use of your time to try to do the same. In fact, the fees for active management are usually much higher than those for passive funds: in 2025 the average actively managed stock fund charged 0.64% a year, against 0.05% for the average index stock fund (ICI, asset-weighted). What Does 1% Cost? shows what that difference compounds to over a lifetime of saving.
This is not intuitive because we’re used to thinking that the more you pay for something, the better it is. But when it comes to investing, the opposite is true: the less you pay, the more you keep. It’s also not intuitive because we’re also used to thinking that the more you do something, the better you get at it. But when it comes to investing, the opposite is also true: the more you do, the more you lose. Therefore my recommendation is to diversify and buy total market index funds.
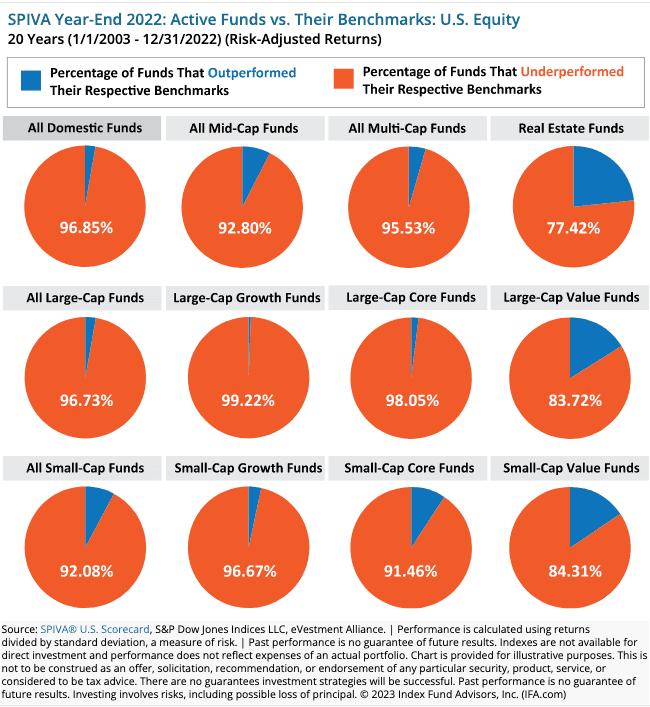
SPIVA, S&P’s scorecard, has been tracking the returns of active managers vs. the market for over twenty years. In its year-end 2025 report, about 93% of large-cap funds and 95% of all U.S. stock funds trailed their benchmark over 20 years. See this report for more comparisons for international equity and fixed income. The results are generally similar.
Importance of Diversification
I love this graphic that’s called an “asset quilt.” It shows the returns of different asset classes year by year. Each color represents a different asset class. The assets are sorted where in a given year, the higher returns are at the top. You can see visually based on how randomly distributed the colors are, how difficult it is for one asset class to consistently outperform the others. Much of this can be explained by reversion to the mean.
I built my own: The Asset Quilt covers eleven asset classes from 2011 to 2025, from Vanguard’s published fund returns. Seven different classes finished first, last year’s winner repeated only twice in fourteen tries, and the 60/40 balanced fund never finished first or last. NovelInvestor keeps a longer one.
Behavior Gap
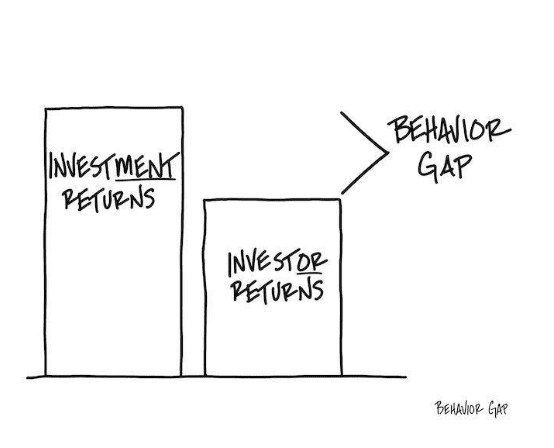
The “behavior gap” is a term that describes the difference between the returns an investment could theoretically yield and the returns an average investor actually achieves. This gap is largely driven by emotional decision-making. Vanguard founder John Bogle highlighted this concept with a striking statistic: from 1997 to 2011, while the average equity mutual fund investment gained 173%, the average equity mutual fund investor earned only 110%. The gap persists: Morningstar’s Mind the Gap 2026 found that over the ten years to 2025, fund investors earned 8.7% a year while their funds returned 9.9%.
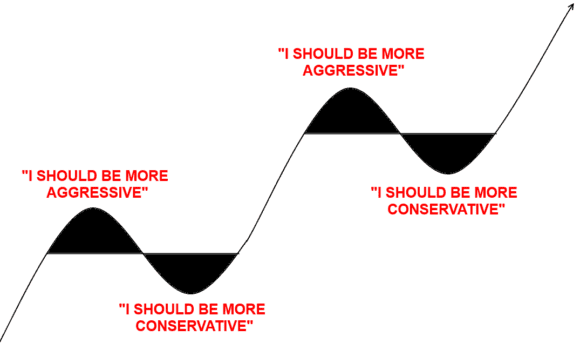
The root of this discrepancy is often attributed to investors letting emotions guide their investment decisions. Instead of adhering to a long-term, disciplined investment strategy, many investors buy when the market is high out of greed and sell when the market is low out of fear. This behavior often results in buying high and selling low, which is the opposite of a successful investment strategy.
Another way to visualize this idea is this realistic graphic of investor emotions:
Further Reading: Behavior Gap
Stock Picking is Hard
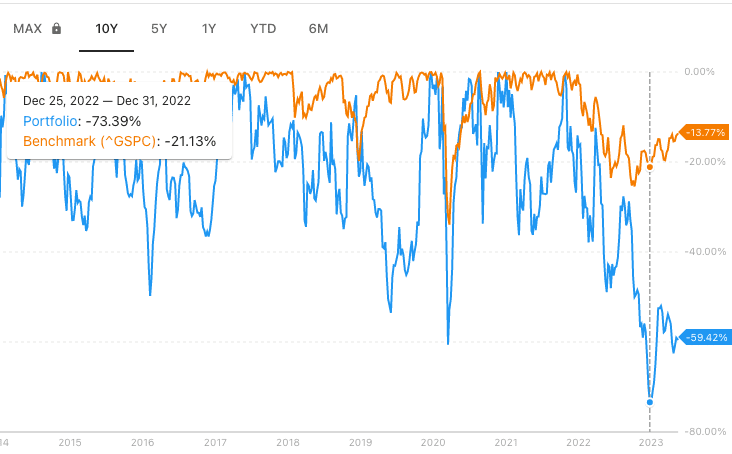
But you might say, what if I just picked Tesla back in 2011? If I had invested $10,000 back then, I would’ve been left with $925,516 come 2023.
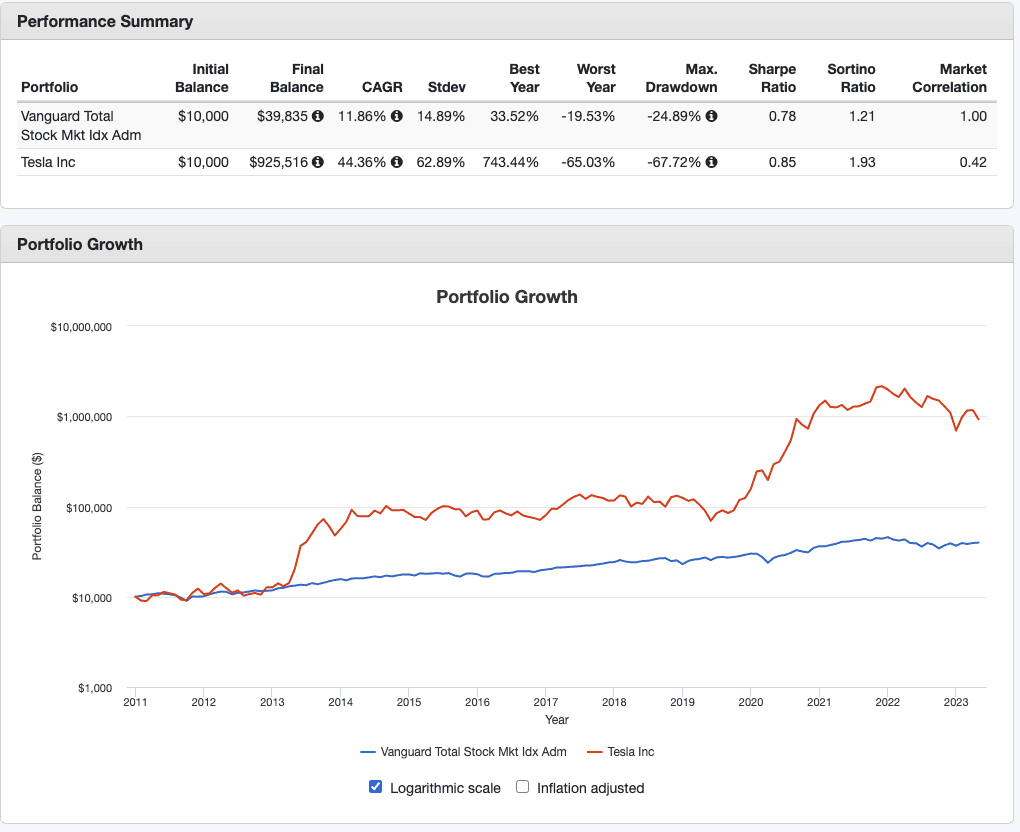
But that makes a couple of large assumptions. It assumes you would’ve been able to hold through these large drawdowns (how much your portfolio is down). Just in the last 10 years (2014-2023), there were separate drawdowns of:
| Depth | Start Date | To Bottom | Bottom Date | To Recover | End Date | Total |
|---|---|---|---|---|---|---|
| -73.63% | Nov 4, 2021 | 291 | Jan 2, 2023 | — | — | — |
| -60.63% | Feb 19, 2020 | 20 | Mar 17, 2020 | 56 | Jun 7, 2020 | 76 |
| -53.51% | Sep 18, 2017 | 428 | Jun 2, 2019 | 139 | Dec 17, 2019 | 567 |
| -49.77% | Sep 4, 2014 | 361 | Feb 9, 2016 | 288 | Apr 2, 2017 | 649 |
| -38.46% | Nov 25, 2010 | 61 | Feb 22, 2011 | 264 | Mar 11, 2012 | 325 |
| -37.68% | Sep 30, 2013 | 41 | Nov 25, 2013 | 50 | Feb 9, 2014 | 91 |
| -36.25% | Jan 26, 2021 | 28 | Mar 7, 2021 | 159 | Oct 20, 2021 | 187 |
| -33.87% | Jun 29, 2010 | 5 | Jul 6, 2010 | 85 | Nov 3, 2010 | 90 |
| -33.74% | Aug 31, 2020 | 5 | Sep 7, 2020 | 52 | Nov 18, 2020 | 57 |
| -31.33% | Apr 3, 2012 | 84 | Aug 1, 2012 | 120 | Jan 27, 2013 | 204 |
Stock Picking is Hard - Reason 1
When it comes to investing in individual stocks, the challenge is akin to finding a needle in a haystack. You’re tasked with picking the right company among thousands, which is far from an easy feat.
Research supports this idea. A study examining the returns of over 25,000 publicly-traded stocks from 1926 to 2016 revealed some insightful statistics. During their lifetimes, more than half of these stocks delivered negative returns. A mere 42% managed to outperform the 3-month Treasury Bill, generally considered one of the safest investments.
The concentration of wealth creation is startling. Just five companies - Exxon, Apple, Microsoft, GE, and IBM - accounted for 10% of all wealth created by the stock market over the 90-year period. Even more striking, only 4% of all stocks were responsible for all the wealth created by the stock market between 1926 and 2016 (Bessembinder, 2018).
These findings highlight the immense difficulty and inherent risk in trying to pick individual stocks. With such a small percentage of companies driving the majority of stock market wealth, the odds of consistently selecting winners are stacked against the average investor.
This evidence further reinforces the argument for a diversified, passive investment strategy. By investing in a broad market index, you’re essentially buying a piece of all companies in that index, which increases your chances of owning the few that will drive most of the market’s returns. It’s a way to spread your risk and increase your odds of capturing the market’s overall growth, without the need to find the proverbial needle in the haystack.
Stock Picking is Hard - Reason 2
Investing in individual stocks involves not only picking the right company to invest in, but also knowing when to hold on to your investment and when to sell. Take the case of companies like Facebook, Amazon, Google, and Netflix, for example. All four of these tech giants experienced significant drawdowns or declines in their stock prices at various points in their histories, yet they remain among the most valuable companies in the world today.
Facebook’s stock has suffered several significant declines, including drops of 50% and 40%, and two more of 20%. Amazon’s stock plummeted by more than 90% during the tech bubble, and even after recovering, it experienced five more declines of 25% or more. Netflix’s stock price has fallen by over 70% three times, by over 50% once, and by 25% four more times. Google’s stock fell by 65% during the financial crisis and had two more declines of 20%.
Investors who sold their shares during these drawdowns would have missed out on the significant returns these companies have generated over the long term. The key takeaway here is that investing in individual stocks requires not just the ability to identify promising companies, but also the discipline and patience to weather the inevitable ups and downs of the market.
Convinced? How to invest covers the accounts to use and two simple index-fund portfolios.